Markets News


EARNINGS


Commodities News


Indian Economy Indicators [ Arthasachi Research ]
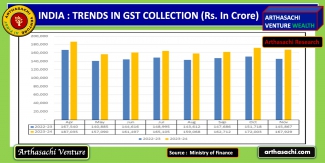
India’s Robust Economy Fuels Records Highest Growth rate of 15% YoY in November GST Revenue collection
India Inflation rate fall to 5.66% returned to below the RBI upper tolerance limit of 6%

India’s Automobile Sector Indicators

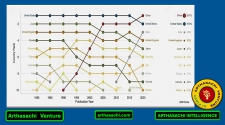
India’s Automobile Sector Indicators [ Rural Demand ]
![India’s Automobile Sector Indicators [ Rural Demand ]](/sites/default/files/styles/max_325x325/public/2022-04/India%E2%80%99s%20Automobile%20Sector%20Indicators%20Rural%20Demand.png?itok=DmK8MlAC)
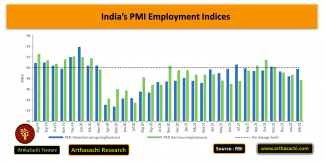
India's PMI Employment Indices
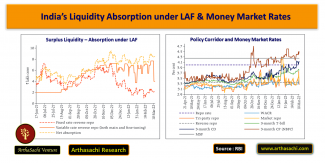
India's Liquidity & Foreign Exchange Reserves
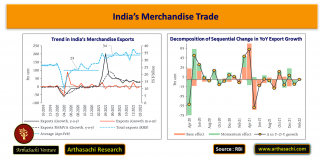
India's Merchandise Trade
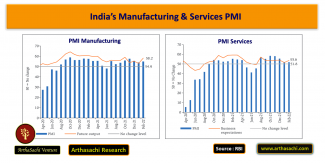
India's Manufacturing & Services PMI
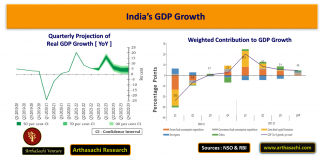
India's GDP Growth
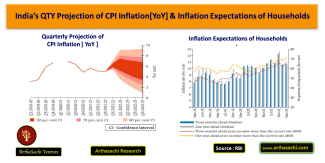
India’s Quarterly Projection of CPI Inflation
RBI Policy Guidance [ Arthasachi Research ]
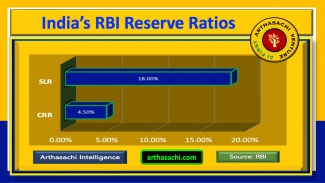
RBI Reserve Ratios (CRR & SLR)
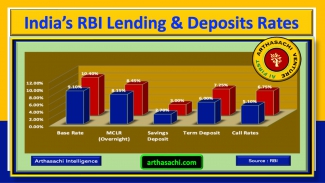
RBI Lending & Deposit Rates
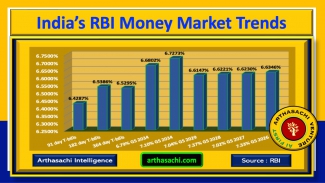
RBI Market Trends
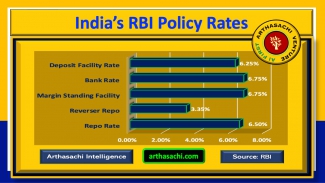
RBI Policy Rates
Market Statisctics [ NSE ]
| Particular | Data |
|---|---|
| Traded Value (Rs. In Crores) | 124,023 |
| Traded Quantity (in Lakhs) | 49,300 |
| Number of Trades | 37,647,908 |
| Total Market Capitalisation (Rs. Crores) | 45,118,729 |
| ADVANCES | 2,292 |
| DECLINES | 1,110 |
| UNCHANGED | 89 |
| Total securities (hit their price bands) | 203 |
MOST ACTIVE [ NSE ]
TOP GAINERS [NIFTY 50]
| Company | Prev. Price | Price | Gain % |
|---|---|---|---|
| ADANIPORTS | 1,434.40 | 1,499.30 | 4.52 |
| LT | 3,882.60 | 4,038.70 | 4.02 |
| HINDALCO | 921.80 | 954.95 | 3.60 |
| NTPC | 365.80 | 378.05 | 3.35 |
| RELIANCE | 1,345.00 | 1,389.40 | 3.30 |
TOP LOSERS [NIFTY 50]
| Company | Prev. Price | Price | Loss % |
|---|---|---|---|
| TECHM | 1,351.20 | 1,333.30 | -1.32 |
| HCLTECH | 1,364.00 | 1,354.10 | -0.73 |
| ICICIBANK | 1,365.40 | 1,357.60 | -0.57 |
| SBIN | 1,174.50 | 1,169.50 | -0.43 |
| TCS | 2,587.80 | 2,578.80 | -0.35 |
NSE Sectorial Indices
| Indices | Prev. Close | OPEN | HIGH | LOW | Price | Change | Change % |
|---|---|---|---|---|---|---|---|
| NIFTY IND DIGITAL | 7,713.35 | 7,770.55 | 7,772.40 | 7,618.50 | 7,706.85 | -6.50 | -0.08 |
| Nifty Tata 25 Cap | 14,374.95 | 14,453.40 | 14,595.55 | 14,338.70 | 14,534.90 | 159.95 | 1.11 |
| Nifty MidSml Hlth | 42,857.20 | 43,020.15 | 43,473.00 | 42,935.90 | 43,416.05 | 558.85 | 1.30 |
| Nifty Multi Mfg | 15,327.40 | 15,410.85 | 15,726.20 | 15,404.30 | 15,669.40 | 342.00 | 2.23 |
| Nifty Multi Infra | 13,566.75 | 13,644.40 | 13,891.00 | 13,642.55 | 13,847.95 | 281.20 | 2.07 |
| BHARATBOND-APR30 | 1,573.10 | 1,573.41 | 1,573.41 | 1,573.40 | 1,573.41 | 0.31 | 0.02 |
| BHARATBOND-APR31 | 1,429.35 | 1,429.61 | 1,429.67 | 1,429.61 | 1,429.67 | 0.32 | 0.02 |
| BHARATBOND-APR32 | 1,300.48 | 1,300.73 | 1,300.93 | 1,300.72 | 1,300.93 | 0.45 | 0.03 |
| BHARATBOND-APR33 | 1,262.91 | 1,263.16 | 1,263.16 | 1,263.15 | 1,263.16 | 0.25 | 0.02 |
| Nifty Ind Defence | 8,088.05 | 8,173.55 | 8,352.25 | 8,147.10 | 8,293.95 | 205.90 | 2.55 |
| Nifty Ind Tourism | 7,347.40 | 7,372.60 | 7,466.65 | 7,302.05 | 7,441.85 | 94.45 | 1.29 |
| Nifty Capital Mkt | 4,452.95 | 4,510.50 | 4,587.90 | 4,501.35 | 4,573.25 | 120.30 | 2.70 |
| Nifty500Momentm50 | 50,312.45 | 50,721.65 | 51,513.55 | 50,684.25 | 51,314.70 | 1,002.25 | 1.99 |
| NiftyMS400 MQ 100 | 45,280.95 | 45,663.10 | 46,237.55 | 45,571.35 | 46,110.30 | 829.35 | 1.83 |
| NiftySml250MQ 100 | 40,046.80 | 40,356.20 | 40,767.70 | 40,259.25 | 40,688.75 | 641.95 | 1.60 |
| Nifty Top 10 EW | 9,041.85 | 9,087.10 | 9,154.85 | 9,038.35 | 9,115.70 | 73.85 | 0.82 |
| Nifty AQL 30 | 22,071.70 | 22,166.80 | 22,382.85 | 22,089.35 | 22,302.30 | 230.60 | 1.04 |
| Nifty AQLV 30 | 20,149.10 | 20,239.15 | 20,441.60 | 20,169.90 | 20,351.40 | 202.30 | 1.00 |
Indian Market [ Arthasachi Research ]
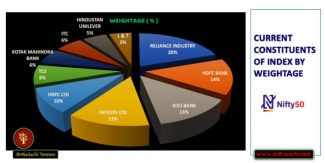
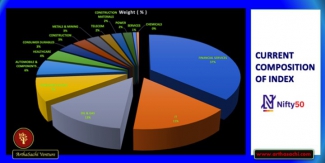
CURRENT CONSTITUENT OF INDEX NIFTY50 [WEIGHTAGE]
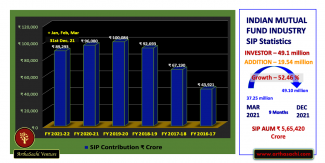
INDIAN MUTUAL FUNDS INDUSTRY SIP Statistics
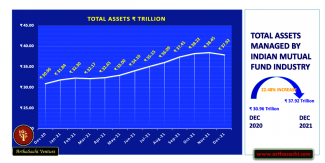
MUTUAL FUND INDUSTRY -TOTAL ASSETS
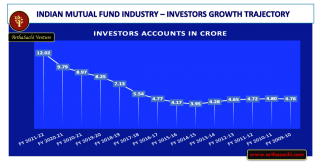
INDIAN MUTUAL FUNDS-INVESTORS GROWTH
Current Composition of INDEX NIFTY 50
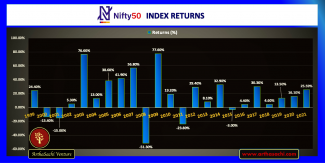
NIFTY 50 INDEX Yearly Return
European Union (EU) Economy Indicators [ Arthasachi Research ]
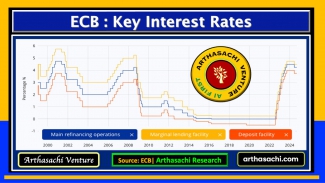
ECB Interest Rates Graph, Sep 2024 Monetary Policy meeting
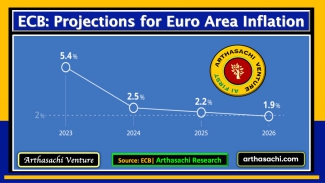
ECB Projections for Euro Area Inflation Sep 2024 Monetary Policy meeting
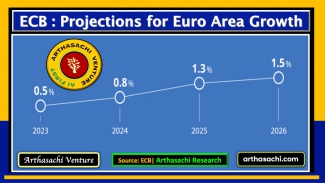
ECB Growth Projections Euro Area Sep 2024 Monetary Policy meeting
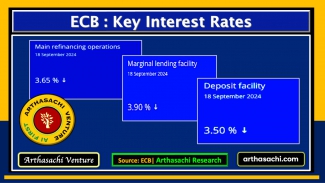
ECB Key Interest Rates September 2024 Monetary Policy Meeting
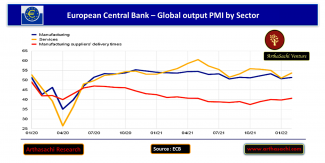
Global output PMI by Sector
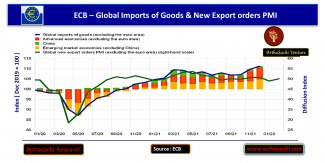
Global Imports of Goods & New Export orders PMI
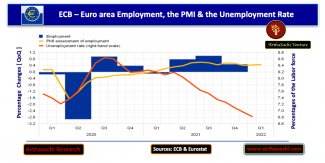
Labour Market
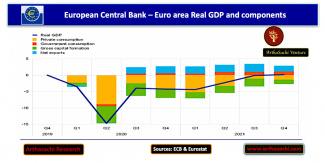
European Union GDP Growth
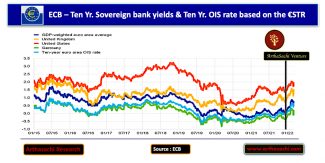
Ten-year sovereign bond yields
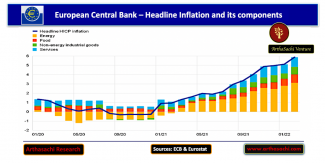
Headline Inflation and its components
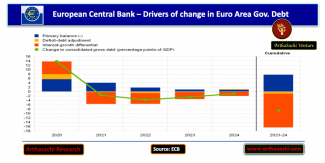
Drivers of Change in EURO Area Government Debts
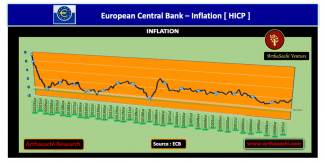
Inflation
ASIA NEWS
EUROPE NEWS
AMERICA NEWS
Arthasachi Venture Footprints
Apps
Dowload Our "Arthasachi Venture Wealth" Apps
Apple IOS App

Andriod App