Markets News
EARNINGS

Commodities News
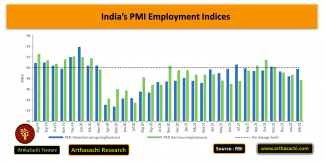
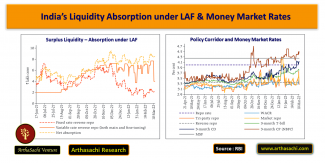
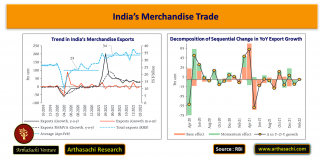
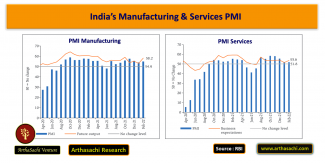
Indian Economy Indicators [ Arthasachi Research ]
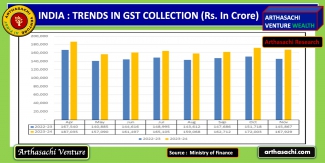
India’s Robust Economy Fuels Records Highest Growth rate of 15% YoY in November GST Revenue collection
Market Statisctics [ NSE ]
| Particular | Data |
|---|---|
| Traded Value (Rs. In Crores) | 135,527 |
| Traded Quantity (in Lakhs) | 64,294 |
| Number of Trades | 39,590,271 |
| Total Market Capitalisation (Rs. Crores) | 46,734,590 |
| ADVANCES | 2,176 |
| DECLINES | 1,039 |
| UNCHANGED | 84 |
| Total securities (hit their price bands) | 182 |
MOST ACTIVE [ NSE ]
| Company | Prev. Price | Close Price | Change % | Value ( Rs Crs ) |
|---|---|---|---|---|
| BAJFINANCE | 964.40 | 963.30 | -0.11 | 1,680.70 |
| BSE | 2,860.80 | 2,896.30 | 1.24 | 1,657.93 |
| ICICIBANK | 1,389.70 | 1,408.40 | 1.35 | 1,558.88 |
| TATSILV | 25.18 | 27.14 | 7.78 | 1,528.93 |
| BHARTIARTL | 1,997.30 | 2,025.80 | 1.43 | 1,510.03 |
| AVANTIFEED | 959.80 | 1,071.70 | 11.66 | 1,347.59 |
| RELIANCE | 1,437.10 | 1,456.80 | 1.37 | 1,212.80 |
| ADANIPOWER | 143.62 | 155.29 | 8.13 | 1,195.67 |
| SILVERIETF | 256.30 | 277.24 | 8.17 | 1,191.30 |
TOP GAINERS [NIFTY 50]
| Company | Prev. Price | Price | Gain % |
|---|---|---|---|
| ETERNAL | 279.80 | 294.15 | 5.13 |
| TRENT | 3,822.80 | 4,012.60 | 4.96 |
| ONGC | 257.00 | 266.95 | 3.87 |
| NTPC | 358.55 | 367.25 | 2.43 |
| ADANIPORTS | 1,530.80 | 1,567.90 | 2.42 |
TOP LOSERS [NIFTY 50]
| Company | Prev. Price | Price | Loss % |
|---|---|---|---|
| INFY | 1,656.00 | 1,535.80 | -7.26 |
| TCS | 3,225.30 | 2,999.10 | -7.01 |
| HCLTECH | 1,695.30 | 1,621.80 | -4.34 |
| TECHM | 1,716.50 | 1,645.30 | -4.15 |
| WIPRO | 242.69 | 233.34 | -3.85 |
NSE Sectorial Indices
| Indices | Prev. Close | OPEN | HIGH | LOW | Price | Change | Change % |
|---|---|---|---|---|---|---|---|
| NiftyM150Momntm50 | 61,406.05 | 61,402.40 | 61,896.80 | 60,993.90 | 61,827.70 | 421.65 | 0.69 |
| Nifty50 USD | 9,876.50 | 9,876.50 | 9,908.20 | 9,627.30 | 9,865.35 | -11.15 | -0.11 |
| Nifty IT | 38,611.75 | 37,165.35 | 37,176.70 | 35,809.50 | 36,345.65 | -2,266.10 | -5.87 |
| Nifty Next 50 | 68,849.40 | 68,889.15 | 69,354.65 | 68,098.35 | 69,298.55 | 449.15 | 0.65 |
| Nifty Bank | 60,041.30 | 60,163.35 | 60,389.40 | 59,891.75 | 60,238.15 | 196.85 | 0.33 |
| NIFTY MIDCAP 100 | 59,307.10 | 59,242.05 | 59,769.50 | 58,794.35 | 59,683.60 | 376.50 | 0.63 |
| Nifty 500 | 23,446.30 | 23,414.10 | 23,562.70 | 23,284.45 | 23,534.95 | 88.65 | 0.38 |
| Nifty 100 | 26,313.20 | 26,270.80 | 26,419.90 | 26,129.25 | 26,382.70 | 69.50 | 0.26 |
| Nifty Midcap 50 | 17,013.20 | 16,988.10 | 17,149.15 | 16,848.00 | 17,123.40 | 110.20 | 0.65 |
| Nifty Realty | 815.30 | 815.45 | 826.00 | 802.00 | 824.45 | 9.15 | 1.12 |
| Nifty Infra | 9,402.10 | 9,428.60 | 9,564.45 | 9,387.55 | 9,549.45 | 147.35 | 1.57 |
| Nifty Energy | 35,657.55 | 35,787.80 | 36,422.30 | 35,669.45 | 36,370.35 | 712.80 | 2.00 |
| Nifty FMCG | 50,806.65 | 50,938.20 | 51,244.90 | 50,725.90 | 50,922.75 | 116.10 | 0.23 |
| Nifty MNC | 30,738.40 | 30,794.80 | 31,074.75 | 30,612.45 | 30,831.30 | 92.90 | 0.30 |
| Nifty Pharma | 22,200.25 | 22,275.80 | 22,323.75 | 22,009.85 | 22,125.80 | -74.45 | -0.34 |
| Nifty PSE | 10,232.25 | 10,251.75 | 10,409.85 | 10,168.90 | 10,396.25 | 164.00 | 1.60 |
| Nifty PSU Bank | 8,819.60 | 8,818.30 | 8,924.35 | 8,747.40 | 8,887.50 | 67.90 | 0.77 |
| Nifty Serv Sector | 33,714.90 | 33,550.80 | 33,637.50 | 33,337.80 | 33,573.70 | -141.20 | -0.42 |
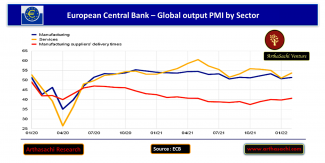
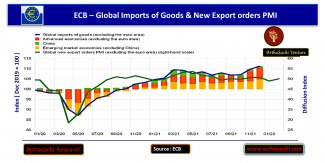
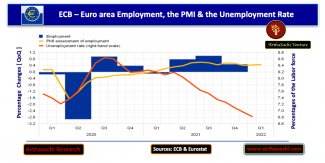
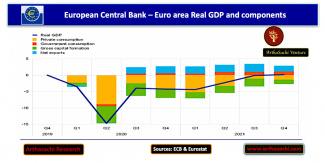
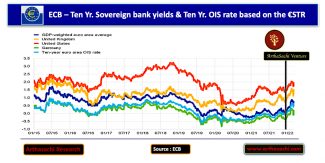
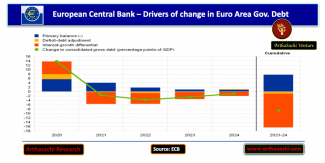
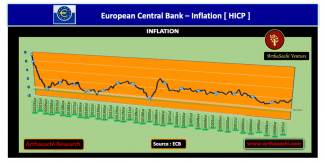
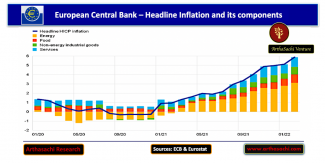
European Union (EU) Economy Indicators [ Arthasachi Research ]
ASIA NEWS
EUROPE NEWS
AMERICA NEWS
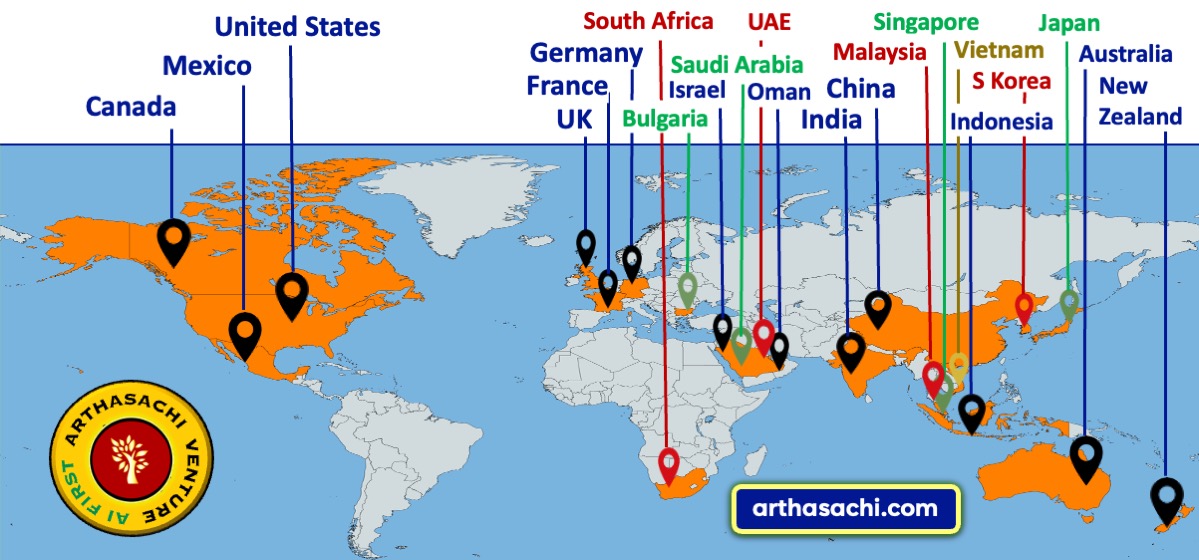
Arthasachi Venture Footprints














![India’s Automobile Sector Indicators [ Rural Demand ]](/sites/default/files/styles/max_325x325/public/2022-04/India%E2%80%99s%20Automobile%20Sector%20Indicators%20Rural%20Demand.png?itok=DmK8MlAC)
